RESULTS OF IMPACT ON VEGETATION STRUCTURE (Action D1)
AREAS WITH HABITAT 5230* AND AREAS OF INCREASE IN THIS HABITAT
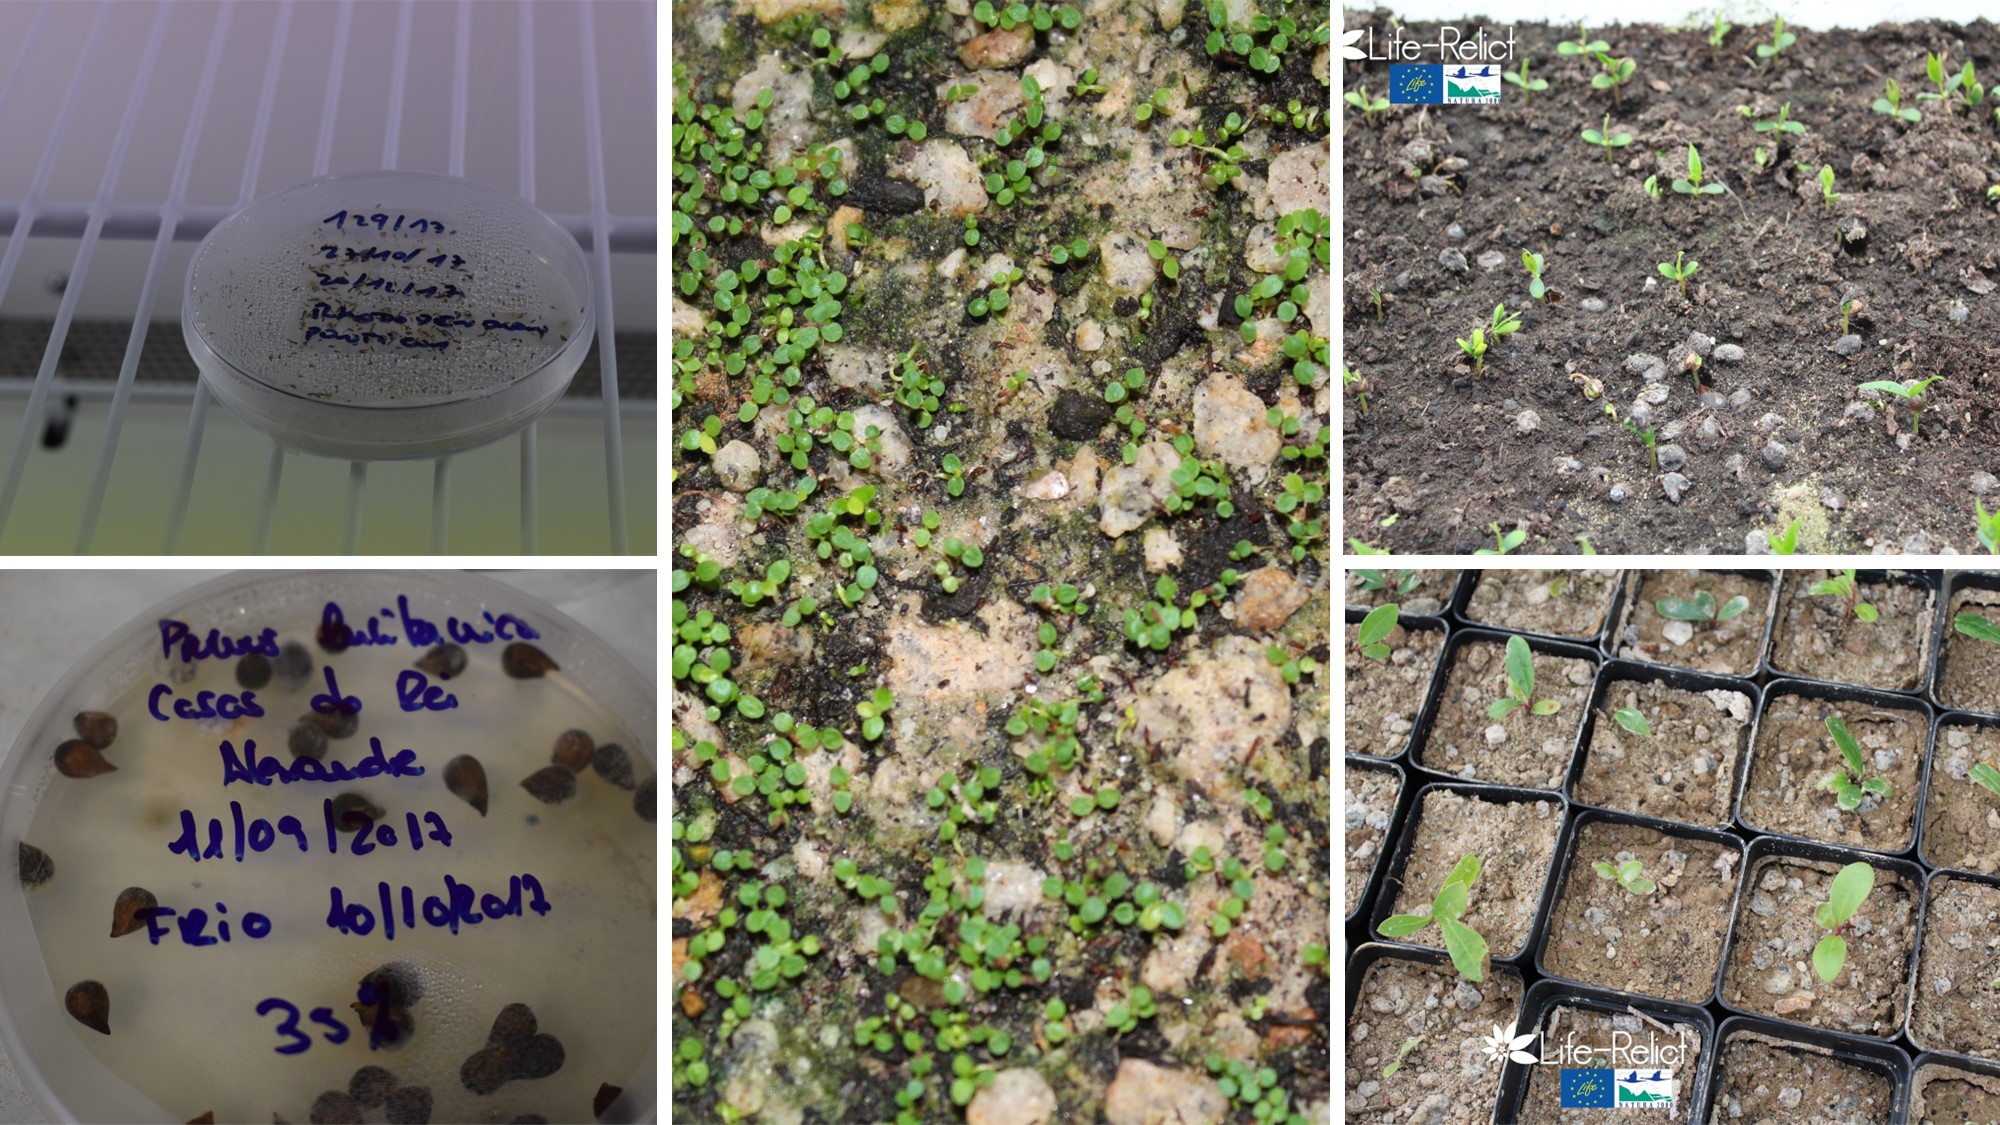
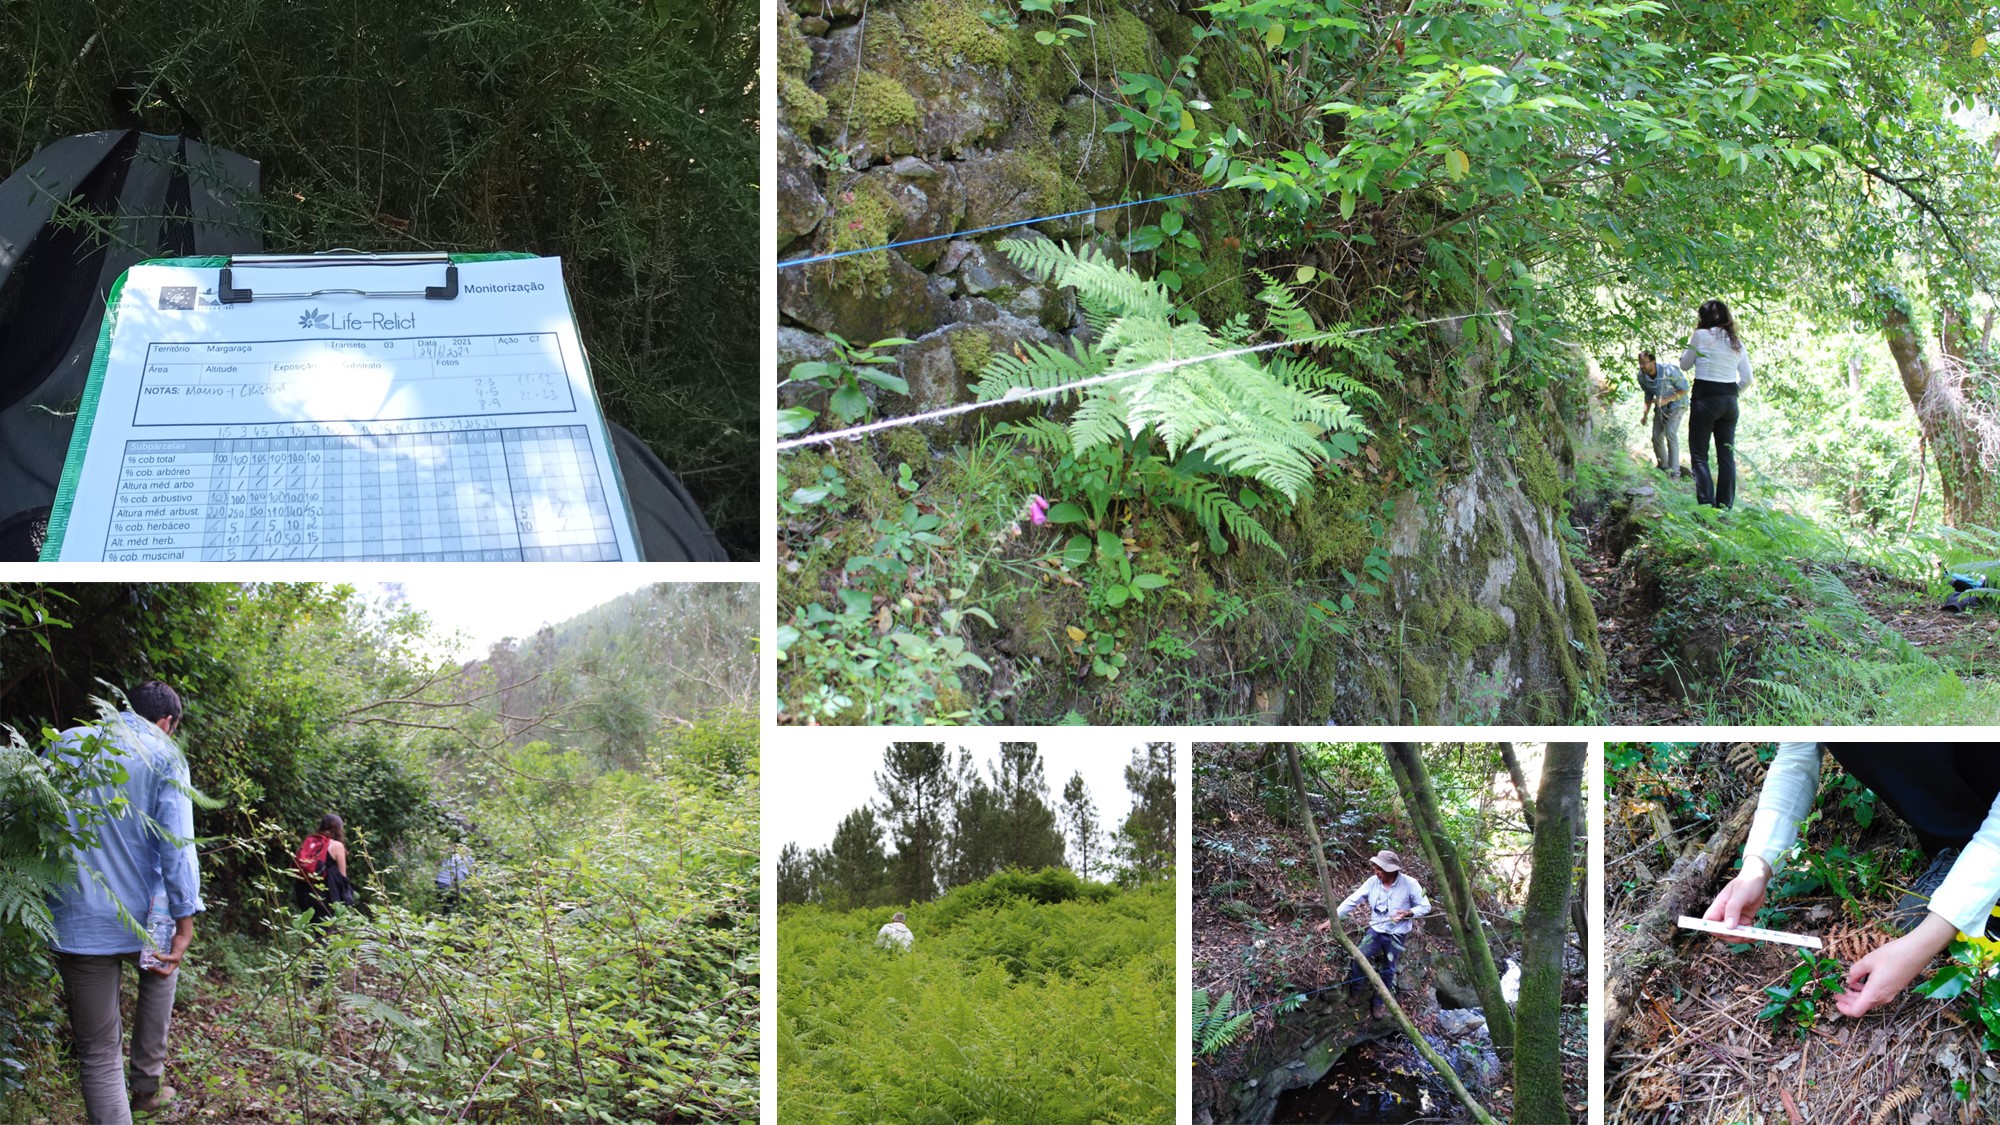
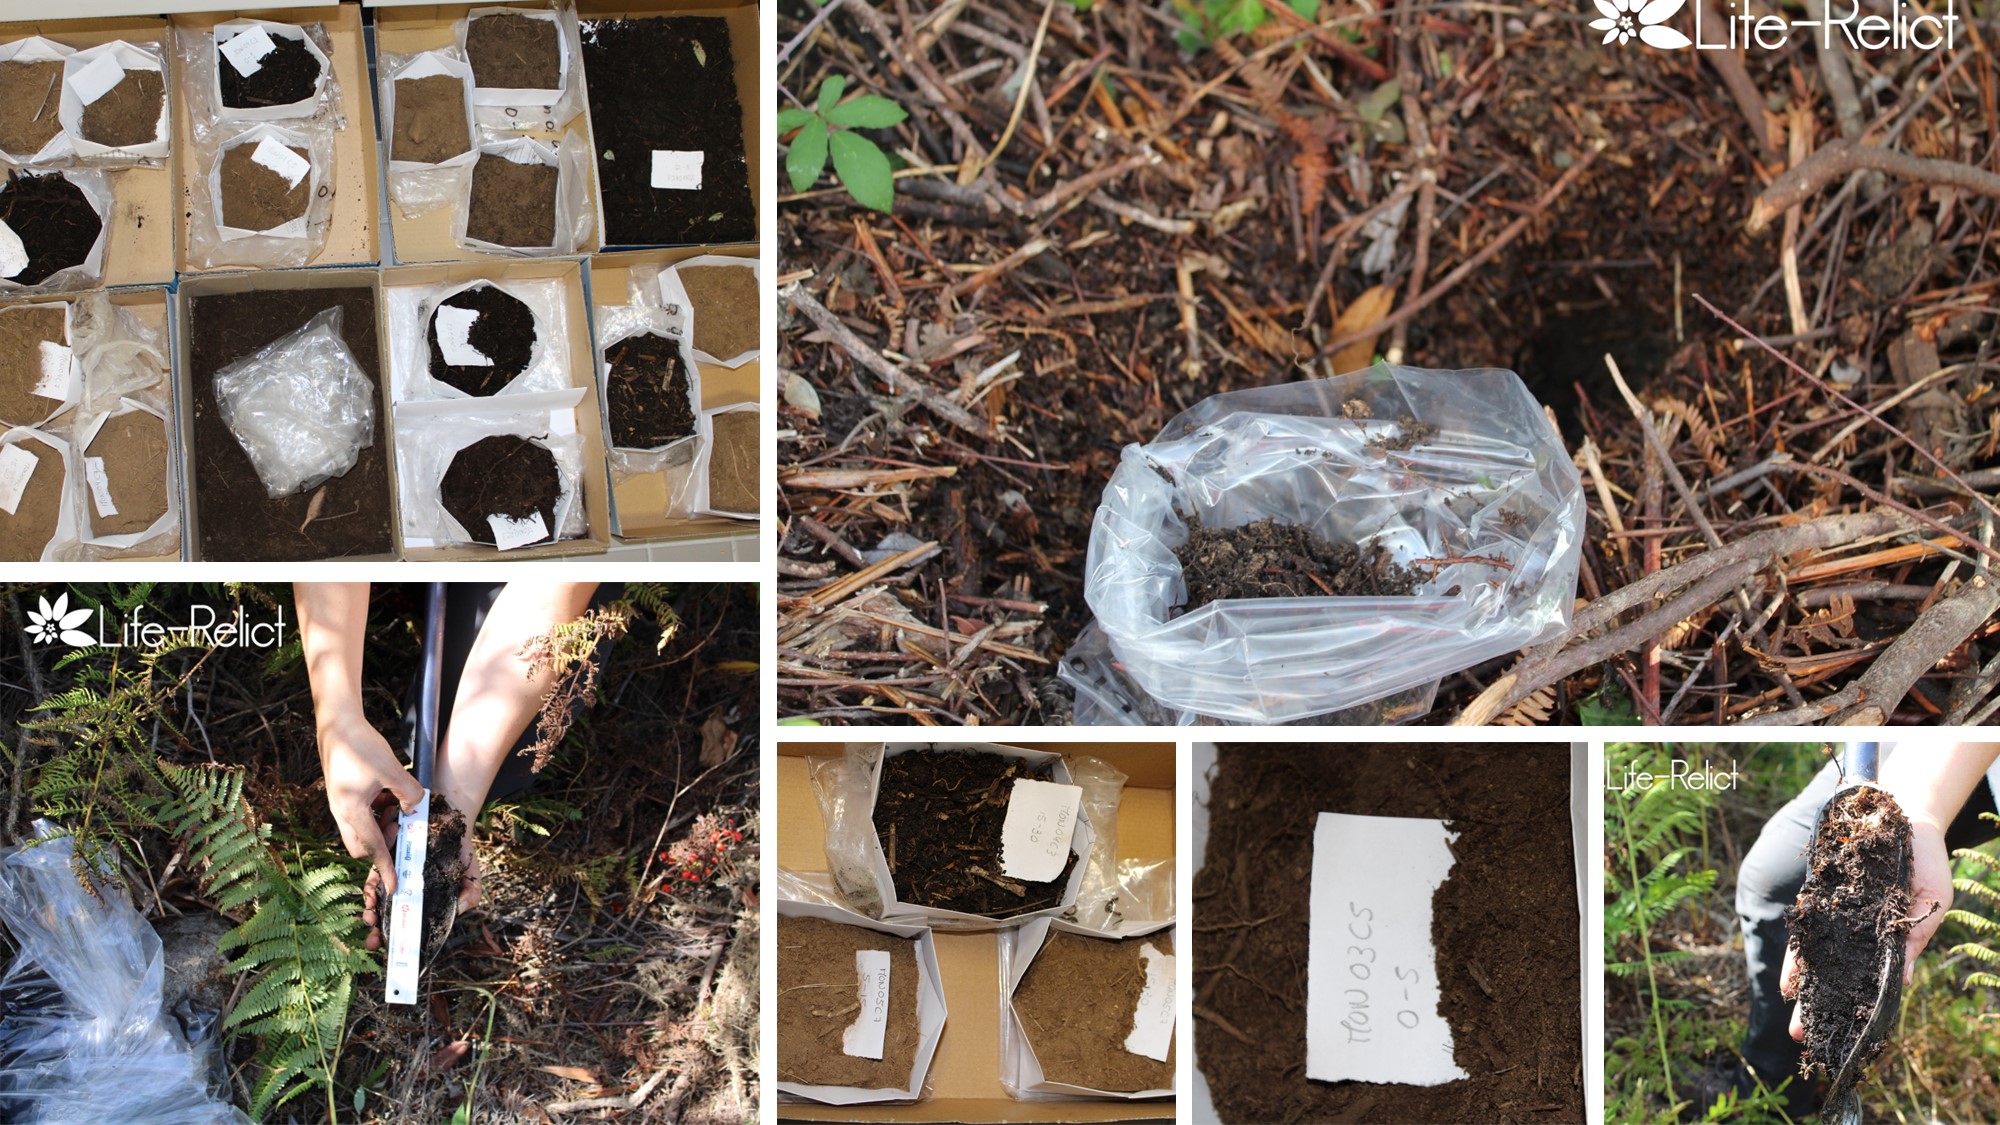
Click on the photographs to enlarge
Click on the photographs to enlarge
Click on the photographs to enlarge
It was possible to improve the structure of habitat 5230* by favoring the coverage of its characteristic plants to the detriment of others whose presence in this habitat is not significant in favorable situations. The definition of the list of species characteristic of the habitat (species to be maintained and planted) and heliophilous species (species to be removed) was made at an early stage of the Project and was based on existing studies on the floristic composition of the communities that make up habitat 5230* and its
natural dynamics. Thus, the main results were:
- Overall, a progressive increase in characteristic species was observed, although slow, due to the forest
nature of the habitat. - A decrease in the coverage of heliophilous species was observed, with the vegetation structure becoming
more resistant to forest fires. In habitat areas, these species must be cut at least every 5 years, until the
system completely closes. In areas of increase, the ideal would be for the cutting to be carried out every 3
years. - The Portuguese Laurel has a large capacity of installation on the ground (above 50% at 5 years), using local ecotypes and selecting their potential areas of occurrence. In the case of the Rhododendron, the installation of new individuals is very difficult. The increase of the installation success depends on the good development of the root system of the new plants, the selection of favorable environments (facing N, NO and O, quite humid, with some light, but not during the hottest hours) and irrigation during the first years of installation. Other species with considerable installation capacity are Viburnum tinus and Arbutus unedo, which is why they should be key species in the recovery and increase of this habitat. In territories where there is grazing, plantations must be carried out using protectors.
DECREASE THREATS TO THE HABITAT 5230*
The main results obtained in relation to the control of invasive alien species and the creation of hardwood forest areas to reduce the risk of fire were:
- Control of Hakea sericea, through cutting, followed by prescribed fire, was highly efficient. During the first
years after the intervention, germinations were still found, but in low numbers and easily removable. - Control of Acacia dealbata through debarking led to the death of all adult individuals on site. However, a
year later, great vegetative regeneration was observed, which must be cut regularly until the plant dies. Control of this species in the intervention area will have to be continued over the next few decades, as happens in other territories. - The planting of species typical of local oak forests, to create these hardwood forests, was started in
both territories, although the objective will only be achieved in several years. In Monchique, the planting
of Quercineas, including Quercus canariensis, carried out with local ecotypes and in potential areas, had a
success rate of over 70% (in 5 years). In Serra da Estrela this success was lower, because of grazing and the presence of wild boars in these areas.
RESULTS OF SOCIOECONOMIC IMPACT (Action D2)
The socioeconomic impact that Life-Relict project had on the intervention areas was monitored through three components, with the main results being:
- These are rural areas, with low population density, advanced age, and low education levels, with a tendency towards abandonment. However, the project’s financial investment in these areas exceeded 18% of the overall budget. Regarding human investment, it is worth highlighting that more than 30 thousand people were involved in organized activities.
- Website users stated that their knowledge of the project had greatly improved as they recognized the ecological importance of the target habitat and that they would recommend the site.
- The local population’s knowledge of the project increased throughout its duration, as did the appreciation
of the ecosystem services associated with the target habitat.
RESULTS FROM ECOSYSTEM FUNCTION IMPACTS (Action D3)
Ecosystem Maintenance and Regulation Services
- 82% Reduction in Fuel Load. The associated costs are lower than the costs of damage caused by the last fires that occurred in the same areas.
- Improving habitat 5230* structure and function. The taxa that benefited most from the interventions were the Portuguese Laurel and the Rhododendron.
- Reduction of areas occupied by invasive alien plants.
- Increase in organic matter in the soil, with special emphasis on oak forests.
Ecosystem Provision Services
- Increase in Arbutus fruit production by around 35 thousand kg, with the economic potential increasing from 5.7 thousand euros to 32 thousand euros/year.
- Wood with economic value. The total value of the wood after 80 years could represent an increase of between 434 and 592 thousand euros.
- Increase in seed production of plant species associated with the target habitat exceeding 231 thousand kilos.
Cultural Ecosystem Services
- Portuguese tourists were more willing to pay for nature-based tourism in Monchique during 2019 than foreigners.
- Evolution of the traditional ecological knowledge of local populations about native species, invasive alien species, target habitat subtypes, their location, characteristics, and associated species.
- Positive contribution to increasing knowledge and competence for environmental management.
- Promotion of social cohesion around Rhododendron, Portuguese Laurel, and continuous habitats (native forest)
- Recognition of the existential value of the target habitat by the local population
- The target habitat must be conserved so that future generations can enjoy it, declared by most of the local population, thus attributing an option value to it.
For more information on other actions, please click on the following images: